At the 2026 Keeneland September Yearling Sale, 30.67% of the yearlings offered in Book 2 failed to sell through the ring, against 15.50% in Book 5B, the cheapest book of the sale. Across the whole auction the ring not-sold rate was 22.43% — 826 of the 3,682 yearlings that went under the hammer did not change hands. The expensive books bought back close to twice as often as the cheap ones.
That runs against what most first-time bidders expect. The assumption is that the cheap end of a sale is where horses fail to sell, and that the glamour books clear because the money is in the room. The hip file says the opposite, and it says it in every one of the last three Keeneland September sales. What follows is the rate book by book, the arithmetic underneath it, and the four things these numbers cannot tell you.
The short version
- Book 2 had the highest ring not-sold rate of the 2026 sale at 30.67 percent; Book 5B the lowest at 15.50 percent.
- Sale-wide, 826 of the 3,682 yearlings offered did not sell through the ring — 22.43 percent.
- Of those 826 buy-backs, 178 sold privately after the ring and 648 were still unsold when the sale closed.
- Book 2 has been the highest book in each of the last three sales and Book 5B the lowest, but the slope between them is not a straight line.
What a buy-back is, in one paragraph
A buy-back is a hip that went through the ring and did not meet the seller’s confidential reserve, recorded in the results as RNA — reserve not attained. The seller keeps the horse. We cover the mechanics of reserves, what RNA means for the horse’s reputation and how it differs from a withdrawal in how to read a thoroughbred sale catalog, and that page is the one to read if the term itself is new to you. This page is about something that page does not have: the rate, and how far it moves between books.
The billionaires would prefer you didn’t know this.
You can own a racehorse with a group of people just like you — and the insiders wrote down how. Free guide, ten minutes.
A rate needs a denominator, and the denominator here is offered — hips that actually entered the ring — not hips printed in the catalogue. That distinction does more work than anything else on this page, and it is where most published commentary on buy-backs quietly goes wrong.
2026 ring not-sold rate, book by book
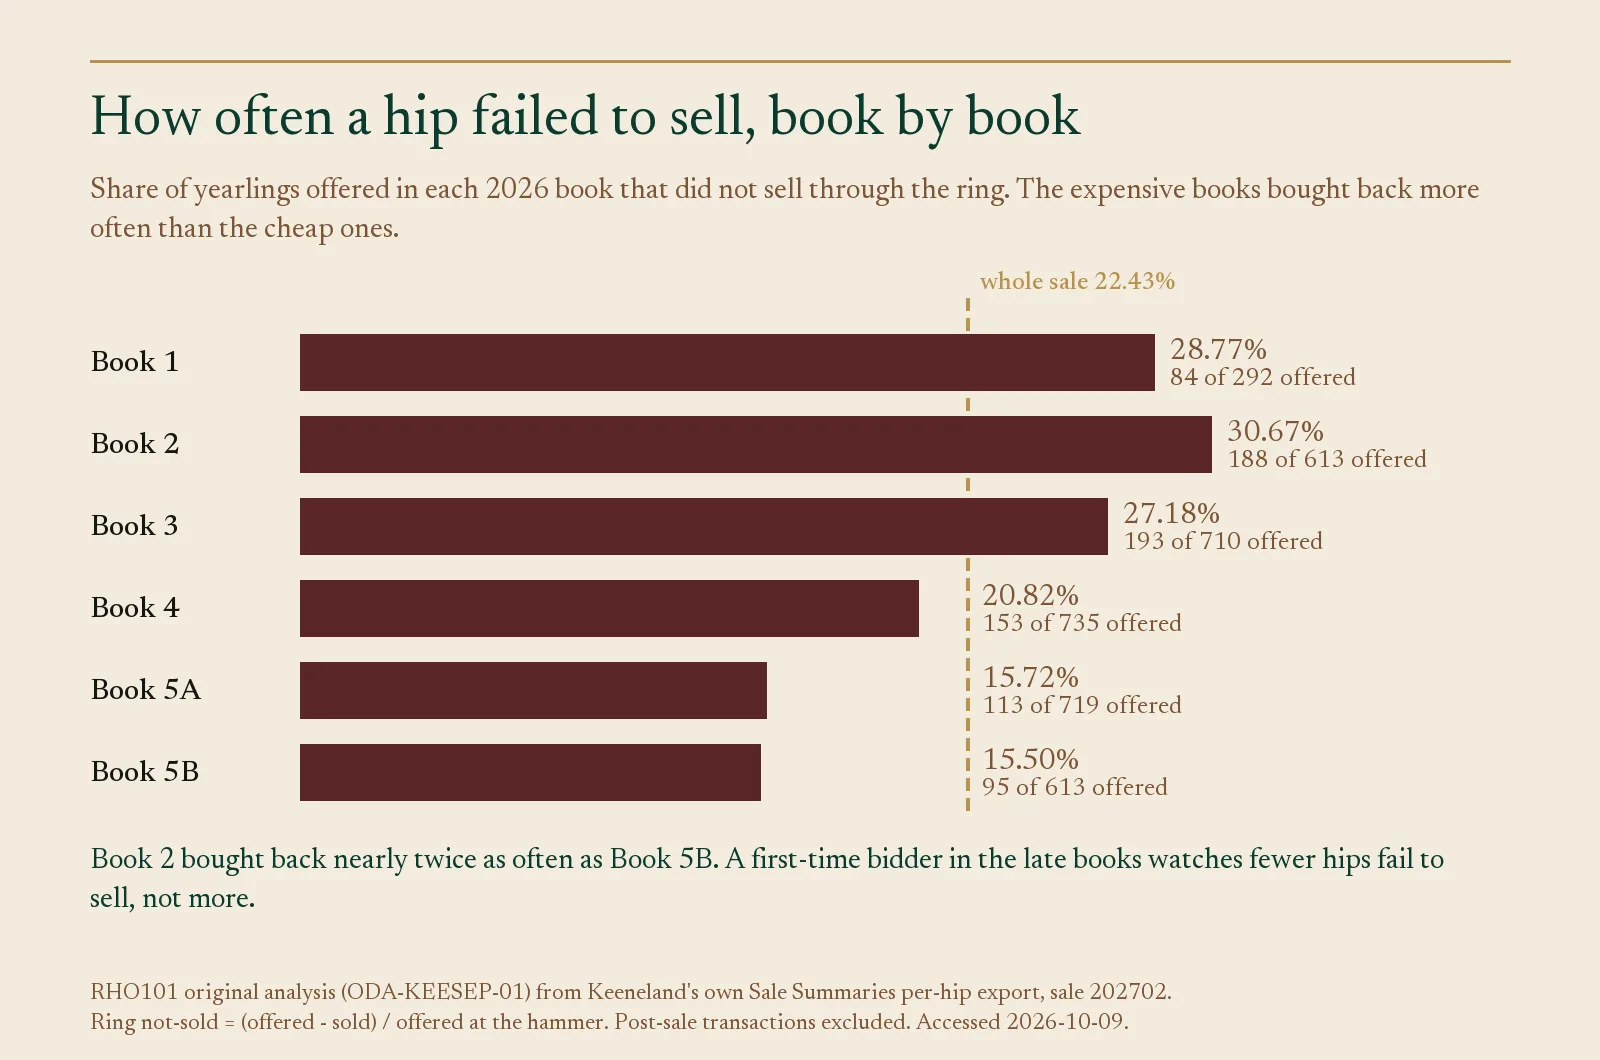
Book 2 had the highest ring not-sold rate of the 2026 sale at 30.67% — 188 of 613 offered — and Book 5B the lowest at 15.50%, or 95 of 613. Book 1 sat at 28.77% (84 of 292), Book 3 at 27.18% (193 of 710), Book 4 at 20.82% (153 of 735) and Book 5A at 15.72% (113 of 719). Three of the six books ran above the sale-wide 22.43% mark and three below it, and the three above it were the three most expensive books of the sale.
The two books with the most expensive yearlings were the two books where the most hips went home unsold.
The reason is not mysterious once you look at what a reserve is for. A Book 1 or Book 2 consignor has a yearling with a page worth protecting and a realistic alternative to selling — race it, pinhook it later, breed from it. The reserve is set high because walking away is a genuine option, and a high reserve is a reserve the room can miss. By Book 5B the economics have inverted: the cost of taking a yearling home and feeding it through to the two-year-old sales is large relative to what the horse is likely to make, so reserves come down and the hammer falls.
For a first-time buyer this is the practical read. Walking into the late books and watching hip after hip sell is the normal condition of those sessions, not a sign that the market has gone soft on quality. Walking into Book 2 and watching a third of the catalogue go home unsold is also normal. Neither tells you anything about the individual horse in front of you.
The 2026 ladder: catalogued, offered, sold
| Stage | 2026 yearlings | What it means |
|---|---|---|
| Catalogued | 4,642 | Printed in the sale catalogue |
| Withdrawn (“out”) | 960 | Scratched before the ring — never offered |
| Offered through the ring | 3,682 | Went under the hammer |
| Sold through the ring | 2,856 | Hammer fell to a buyer |
| Not sold through the ring | 826 | Reserve not attained — the 22.43% |
| — of those, sold privately after | 178 | Post-sale deals, negotiated off the ring |
| — of those, still unsold | 648 | Remaining RNA at the end of the sale |
Of the 4,642 yearlings catalogued for Keeneland September 2026, only 2,856 sold through the ring — 61.5% of the catalogue. The gap is made up of 960 withdrawals before the sale and 826 hips that went through without meeting a reserve. Catalogued is a publishing decision, offered is a race-morning decision, and sold is the only one of the three that involves a buyer.
This matters for anyone reading sale coverage. A recap that leads with the catalogue size and the gross is describing two numbers with 1,786 horses of daylight between them. If you are trying to judge whether a sale was strong, the ratio you want is sold over offered, and you will almost never be handed it.
Ring RNA is not the same as unsold
The 22.43% ring not-sold rate measures what happened at the hammer, and a meaningful share of those horses sold afterwards anyway. In 2026, 178 of the 826 buy-backs were placed privately in post-sale deals worth $21,575,500 — which is exactly why Keeneland’s headline gross of $558,313,400 sits above the $536,737,900 that actually passed through the ring. That leaves 648 yearlings genuinely unsold at the end of the sale.
826 yearlings failed to sell at the hammer. 178 of them sold privately afterwards. 648 went home.
Book 1 shows the size of the correction. Its 28.77% is a hammer figure; 64 Book 1 hips were still RNA once post-sales were done. Any comparison you make between books has to use the same definition on both sides, because ring RNA and remaining RNA are different quantities and the published figures do not always say which one they are quoting.
Every rate on this page is a hammer rate, and post-sale transactions are excluded from all of them. Keeneland’s own 2026 wrap-up release publishes both gross figures and separates the post-sale total, which is what makes the two versions reconcilable at all.
Does the pattern hold from year to year?
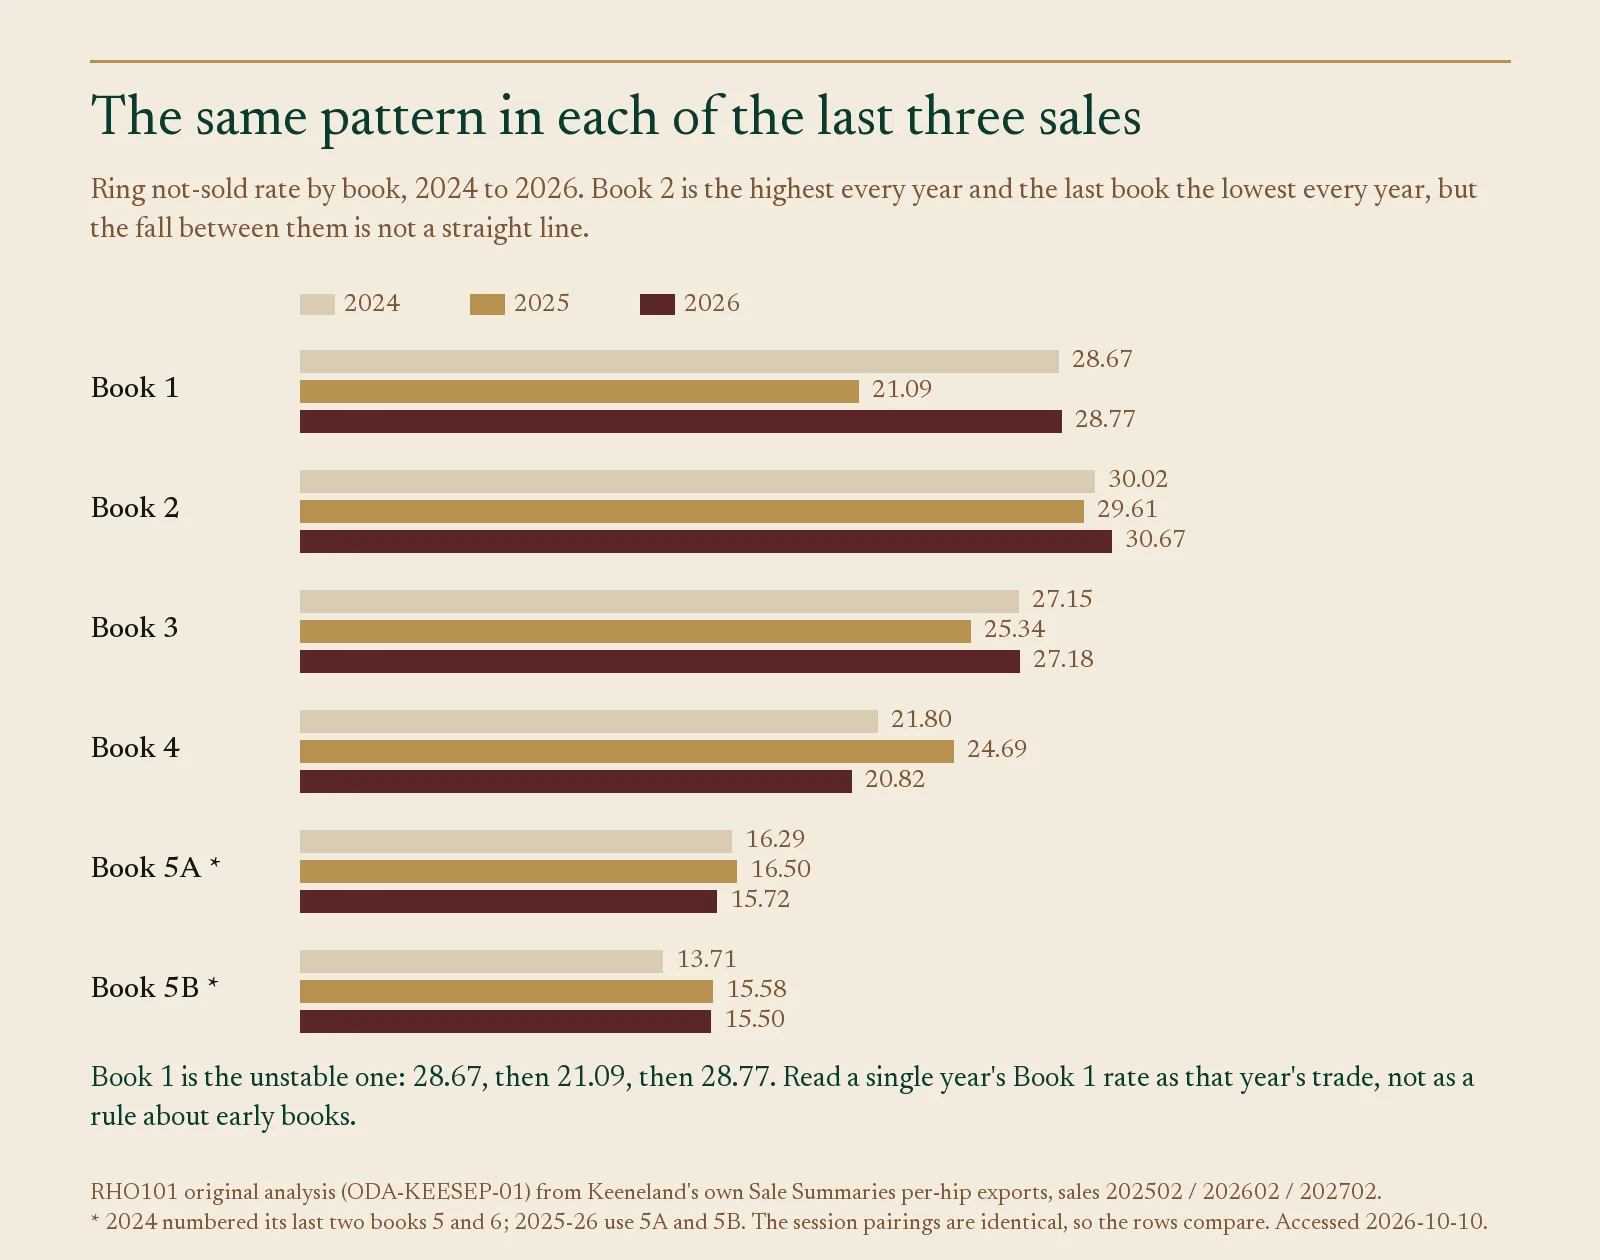
Book 2 had the highest ring not-sold rate in all three sales — 30.02% in 2024, 29.61% in 2025, 30.67% in 2026 — and the last book of the sale the lowest in all three, between 13.71% and 15.58% — Keeneland numbered that book 6 in 2024 and 5B in 2025 and 2026. The two ends of the pattern are stable, and that is the part worth carrying into a sale.
Book 2 is the most reliable number on this page. Book 1 is the least.
The middle is not. Book 1 ran 28.67%, then 21.09%, then 28.77%, and in 2025 it was the fourth-highest book of six, sitting below Book 4’s 24.69%. So the honest version of this finding is narrower than “the rate falls as the books get cheaper.” The rate at the expensive end is reliably higher than the rate at the cheap end; the slope between them is not a straight line, and Book 1 in particular reflects that year’s trade rather than a standing rule about early books.
Comparing books across years carries one more trap. The session-to-book map is Keeneland’s to set, and if it changes, a year-on-year book comparison stops meaning what it looks like it means. We checked the grouping against Keeneland’s own hip grouping schedule for all three sales, and it is worth being precise about what that check found. The session pairings are identical — the fifth pair of sessions is the fifth book in every year — so the rows compare. The names are not: Keeneland numbered its final two books 5 and 6 in 2024, and 5A and 5B from 2025. The chart above uses the current names for all three years.
What these numbers do not say
The per-hip file supports rates and counts, and it stops well short of several things a reader might reasonably want from it. Four limits are worth stating plainly.
- Nothing about who was buying. The export carries buyer names, not buyer types. It cannot tell you whether the late books cleared because pinhookers were active or because end-users were.
- Nothing about quality. There is sire and dam on the file, and no conformation or veterinary dimension. A low buy-back rate in Book 5B is not evidence those horses were better value.
- Nothing about an individual horse. A buy-back is a disagreement on price between a seller and a room on one afternoon. It is not a verdict, and treating it as one is the most common way first-time buyers misread a results page.
- Nothing before 2024. Keeneland publishes earlier years as sale-wide figures only; no per-hip file was pulled for them, so the trend here is three sales deep and no deeper.
How these figures were produced
Every figure on this page comes from Keeneland’s own published Sale Summaries per-hip export — an official download, not a scrape — for sale IDs 202702, 202602 and 202502. Each hip carries its number, sex, sire, dam, consignor, buyer, price and its RNA, post-sale or withdrawn flag. Rates are counted from those flags; none is derived from an average.
Each year’s sold count, gross, average and median was reconciled against Keeneland’s own wrap-up release before we used it. The 2026 and 2024 figures match exactly. The 2025 release reported 3,070 sold including post-sales where the file shows 3,078, an eight-hip post-sale restatement; we use the through-the-ring count of 2,904, which is the figure that keeps the year comparable to the other two. That is the standard we would want applied to anyone else’s numbers, so it is the one we apply to our own.
Frequently asked questions
What is the RNA rate at Keeneland September?
The 2026 Keeneland September ring not-sold rate was 22.43% — 826 of 3,682 yearlings offered did not sell through the ring. By book it ran from 30.67% in Book 2 down to 15.50% in Book 5B.
Why do Book 1 and Book 2 buy back more often than Book 5?
Consignors in the early books set higher reserves because they have a real alternative to selling — racing, breeding or pinhooking the yearling later. A high reserve is a reserve the bidding can miss. In the late books the cost of keeping an unsold yearling is large relative to its likely price, so reserves come down and more hips clear.
What is the difference between ring RNA and remaining RNA?
Ring RNA counts hips that failed to meet their reserve at the hammer. Remaining RNA counts those still unsold after post-sale deals are done. In 2026 there were 826 ring RNAs and 648 remaining RNAs, because 178 buy-backs were placed privately afterwards.
Does catalogued mean sold?
No. Of 4,642 yearlings catalogued for Keeneland September 2026, 960 were withdrawn before the ring and 826 of the 3,682 offered did not sell. Only 2,856 sold under the hammer — 61.5% of the catalogue.
Are post-sales counted as sold through the ring?
No, and the distinction changes the headline. Keeneland’s 2026 gross of $558,313,400 includes $21,575,500 of post-sale business; the through-the-ring figure is $536,737,900. Every rate on this page excludes post-sales.
What to read next
If you are deciding which Keeneland September session to attend with a given budget, that is the job of our Keeneland September session guide, which maps books to price levels. If reserves, black type and the mechanics of a catalogue page are what you need, start with how to read a thoroughbred sale catalog. For what a first-time budget actually reached in the same sale, we counted the hips a $50,000 budget could have bought — 1,021 of the 2,856 sold, 95% of them in Books 4, 5A and 5B, which is the same clustering seen from the other side. And if you have not yet settled on buying at public auction at all, our guide to every route into ownership sets auction against claiming, private purchase and syndicate shares.
The habit worth taking from this page is small. Before you read a single hip, find the not-sold rate of the book you are sitting in. It tells you what a normal afternoon looks like in that room, so that when a horse you marked goes home unsold, you know whether you watched something ordinary or something worth asking about.
About the Author

Calvin Johnson is a Thoroughbred racehorse owner, day trader, and independent racing analyst with more than a decade of firsthand ownership experience. He has participated in nearly every common structure in horse racing — fractional platform shares, traditional syndicates, LLC partnerships, claiming ventures, and outright ownership — across more than two dozen horses. Calvin writes about racehorse ownership the same way he approaches markets: by studying risk, incentives, fees, and whether the people controlling the deal are aligned with the investors behind it.
- Calvin Johnsonhttps://racehorseownership101.com/author/calvin-johnson/

- Calvin Johnsonhttps://racehorseownership101.com/author/calvin-johnson/

- Calvin Johnsonhttps://racehorseownership101.com/author/calvin-johnson/

- Calvin Johnsonhttps://racehorseownership101.com/author/calvin-johnson/